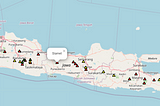
Lia RistianainTowards Data ScienceHow to Create A Map from Geospatial Data in PythonPlotting Location Data of Indonesian Volcanoes into A Map using FoliumJan 19, 2022Jan 19, 2022
Lia RistianainAnalytics VidhyaYour Top 100 Songs 2020 in Python and PlotlyI look into the “Your Top Songs 2020” playlist generated by Spotify last year and put it in Python. Here’s what I found so far about my…Mar 4, 2021Mar 4, 2021
Lia RistianainNerd For TechHow to Plot Timeseries Data in Python and PlotlyA simple tutorial on handling time series data in Python from extracting the dates and others to plotting them to charts.Feb 28, 20211Feb 28, 20211
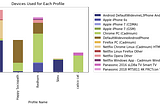
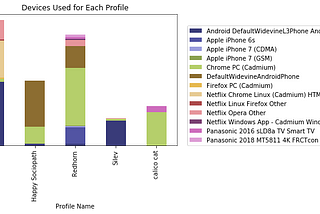
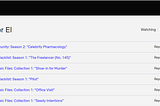
Lia RistianaVisualizing My Netflix Viewing Activity with Python and Matplotlib (Part II)How to find out your Netflix viewing patterns using your own Netflix data for fun.Aug 26, 20201Aug 26, 20201
Lia RistianaVisualizing My Netflix Viewing Activity with Python and MatplotlibLet me start this post by stating that this is my first post on Medium, s̶̶̶o̶̶̶ ̶̶̶b̶̶̶e̶̶̶ ̶̶̶p̶̶̶r̶̶̶e̶̶̶p̶̶̶a̶̶̶r̶̶̶e̶̶̶d̶̶̶…Jul 11, 2020Jul 11, 2020